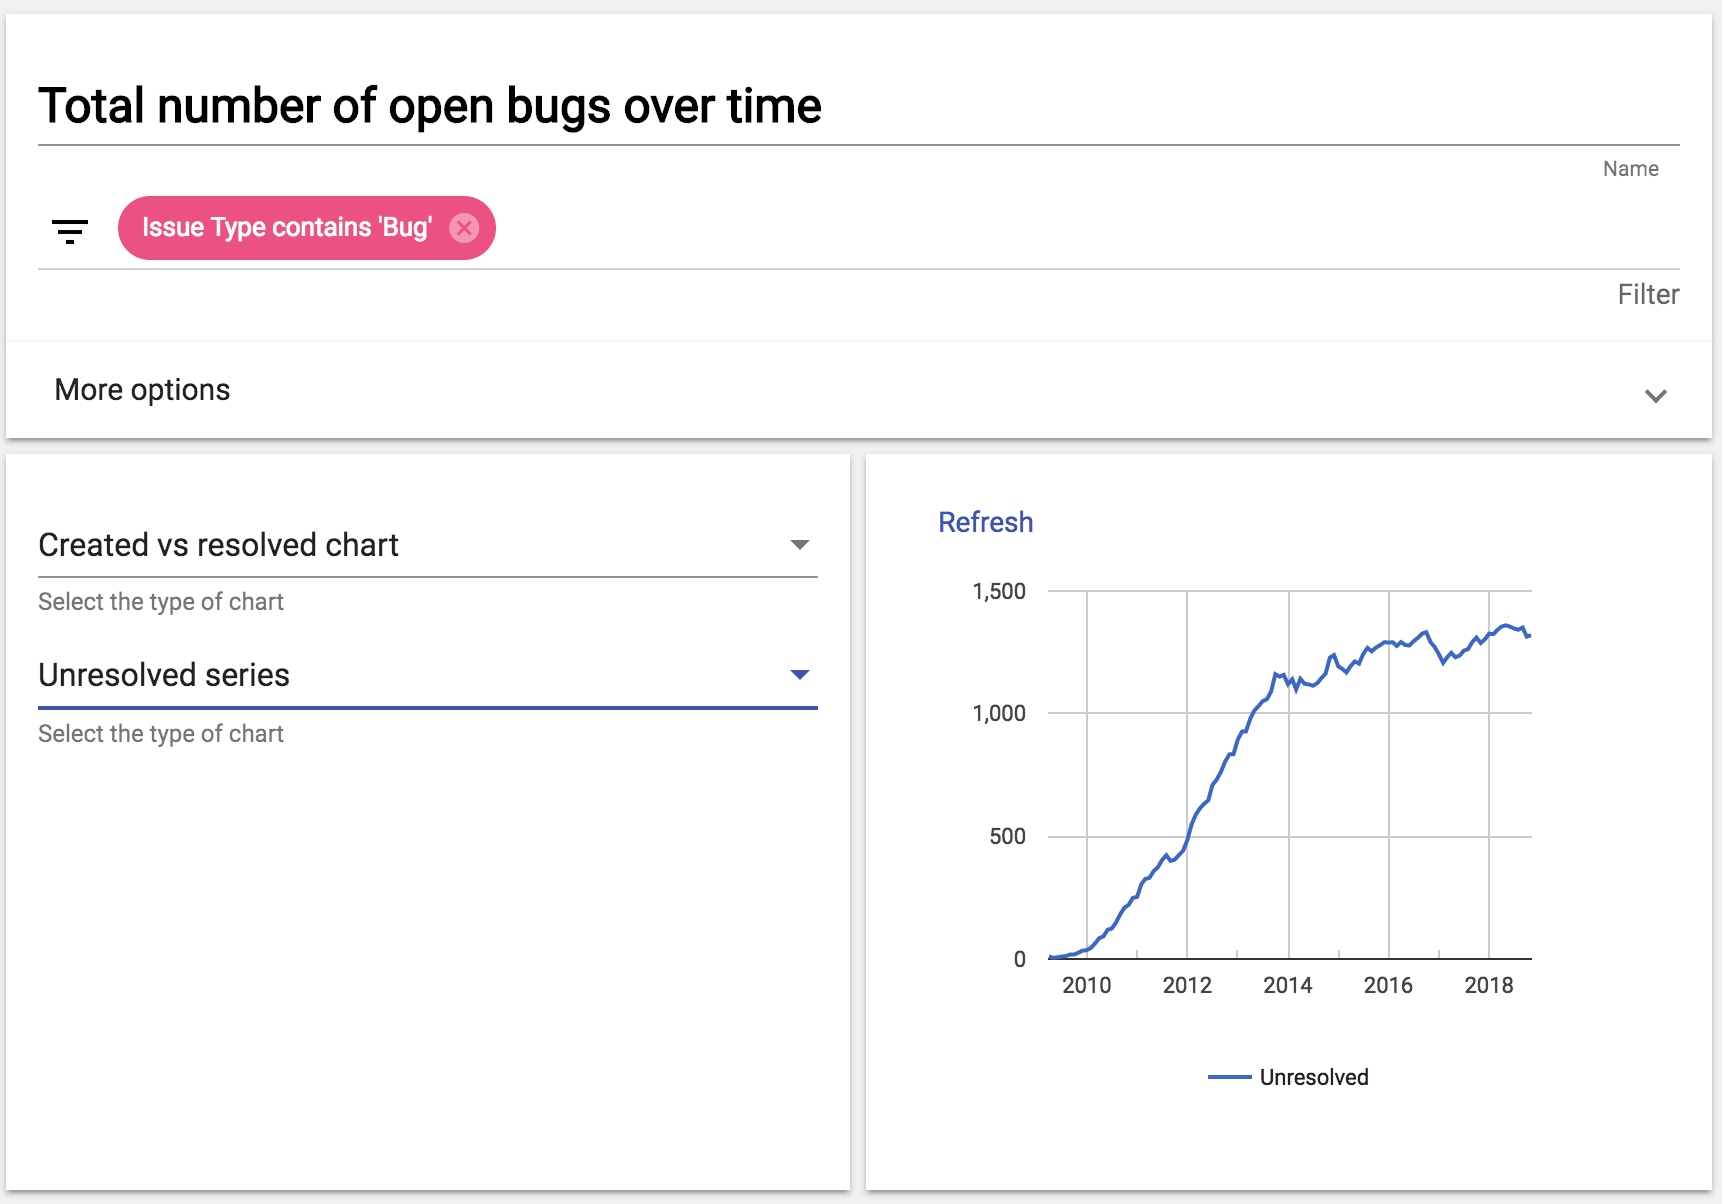
How to create a chart that shows the total number of open bugs over time?
Simply create a “created vs resolved chart” and customize it to draw a single time series with the number of unresolved tickets. Also, use the filter to select the cases.
This question was posted on the Jira forum website . See the page here.