Numerical fields
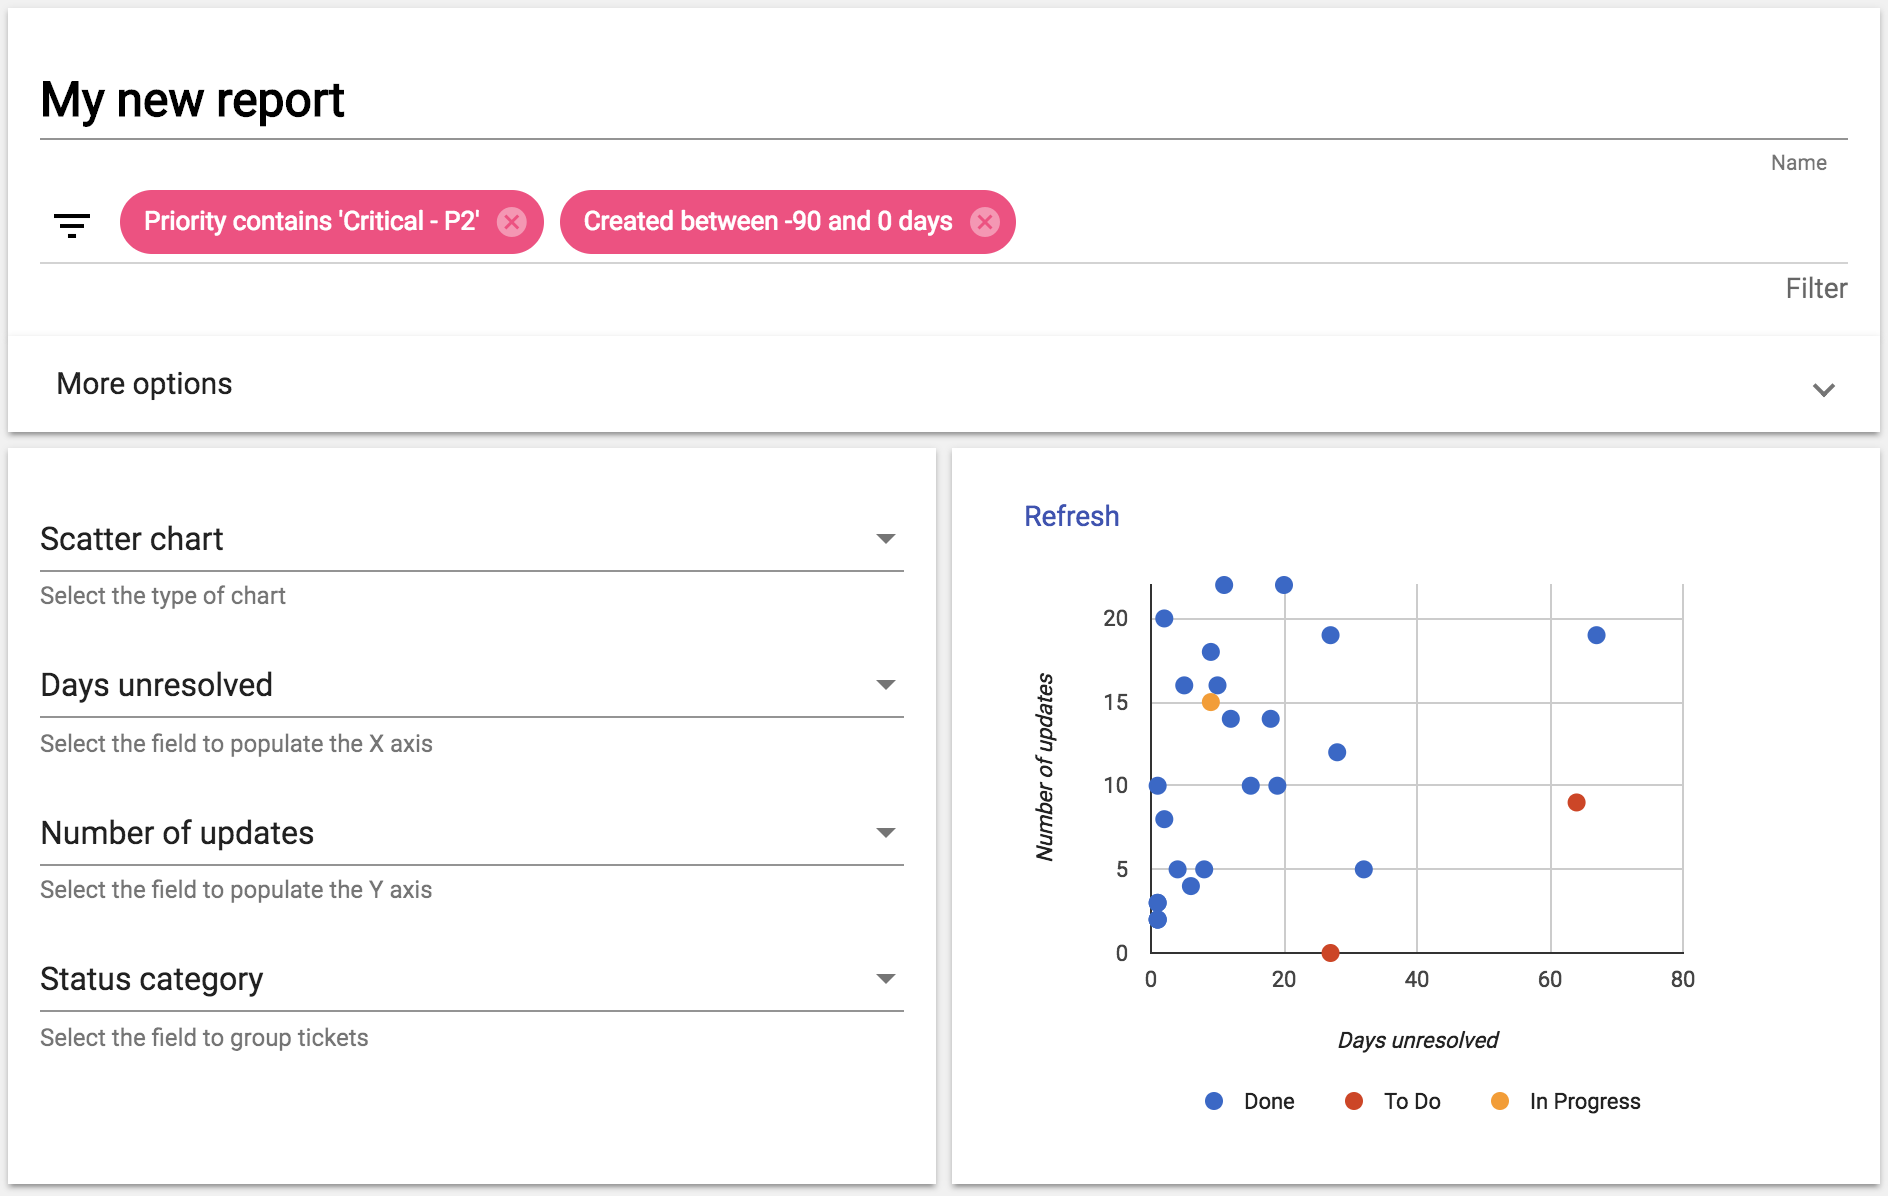
The Scatter chart contains two fields, one for each axis:
- a field to populate the x axis
- a second field to populate the y axis
Group field
This can be used optionally to use a different color for the each point according to the discrete value of the given group field.