Overview
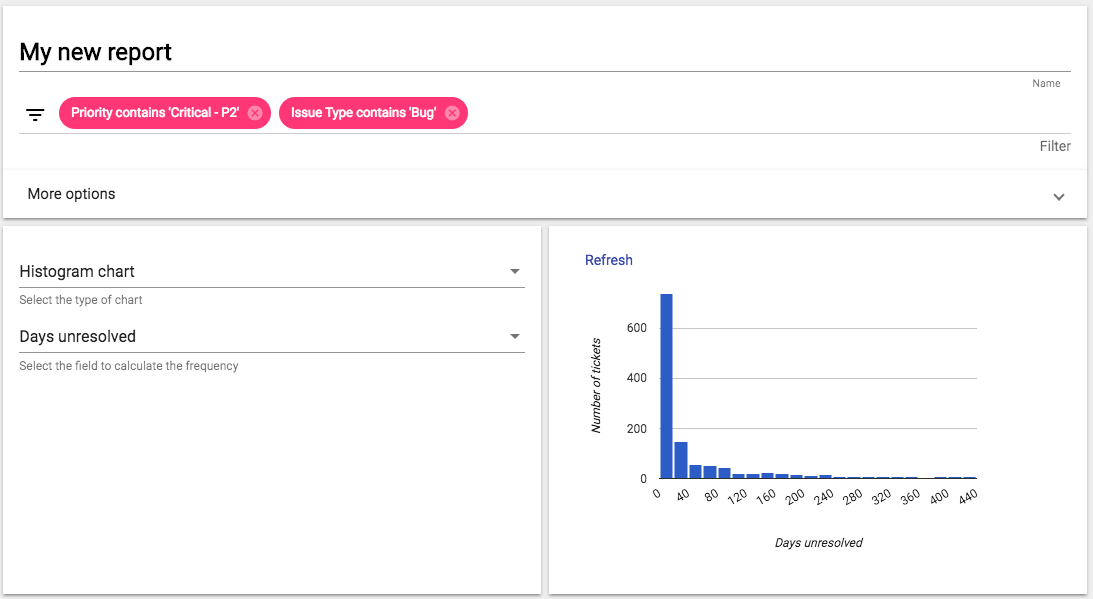
The histogram chart shows an accurate representation of the distribution of numerical data. It represents the given tickets value, e.g. “days unresolved”, “days to due date”.
The histogram chart displays a representation of the distribution of numerical data.
The histogram chart shows an accurate representation of the distribution of numerical data. It represents the given tickets value, e.g. “days unresolved”, “days to due date”.