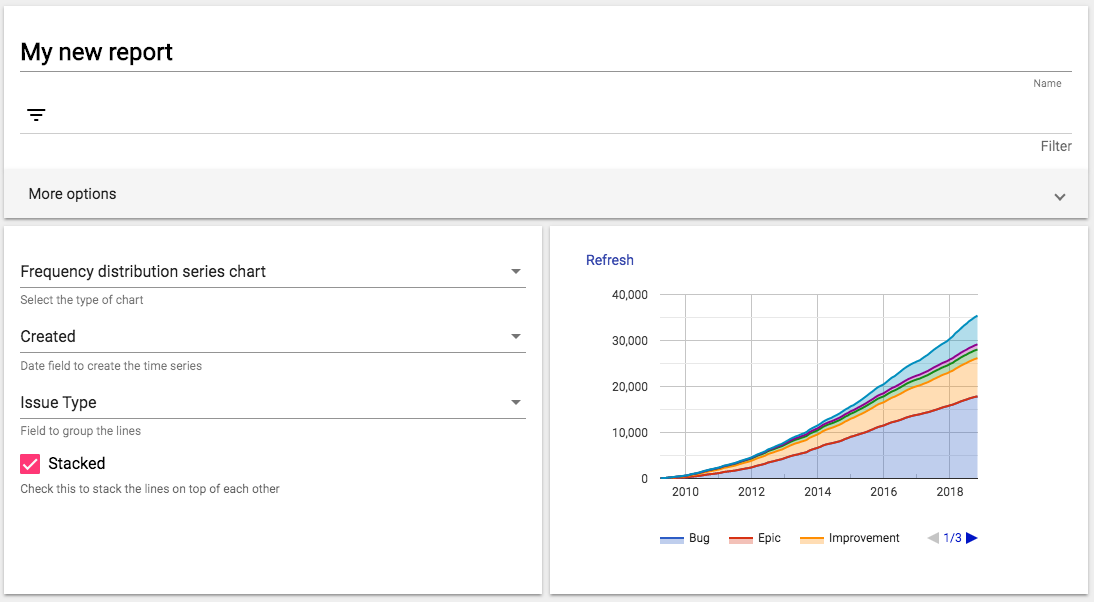
Date field
The time series can be calculated by
- Creation date: each data point will be calculated based on the ticket creation date.
- Resolution date: each data point will be calculated based on the ticket resolution date.
Group field
The field to group the tickets. The chart will display one line for each value of the given variable.
Stacked
The series can be stacked, i.e. one on top of each other. if this option is unchecked the series will be displayed independently.