Overview
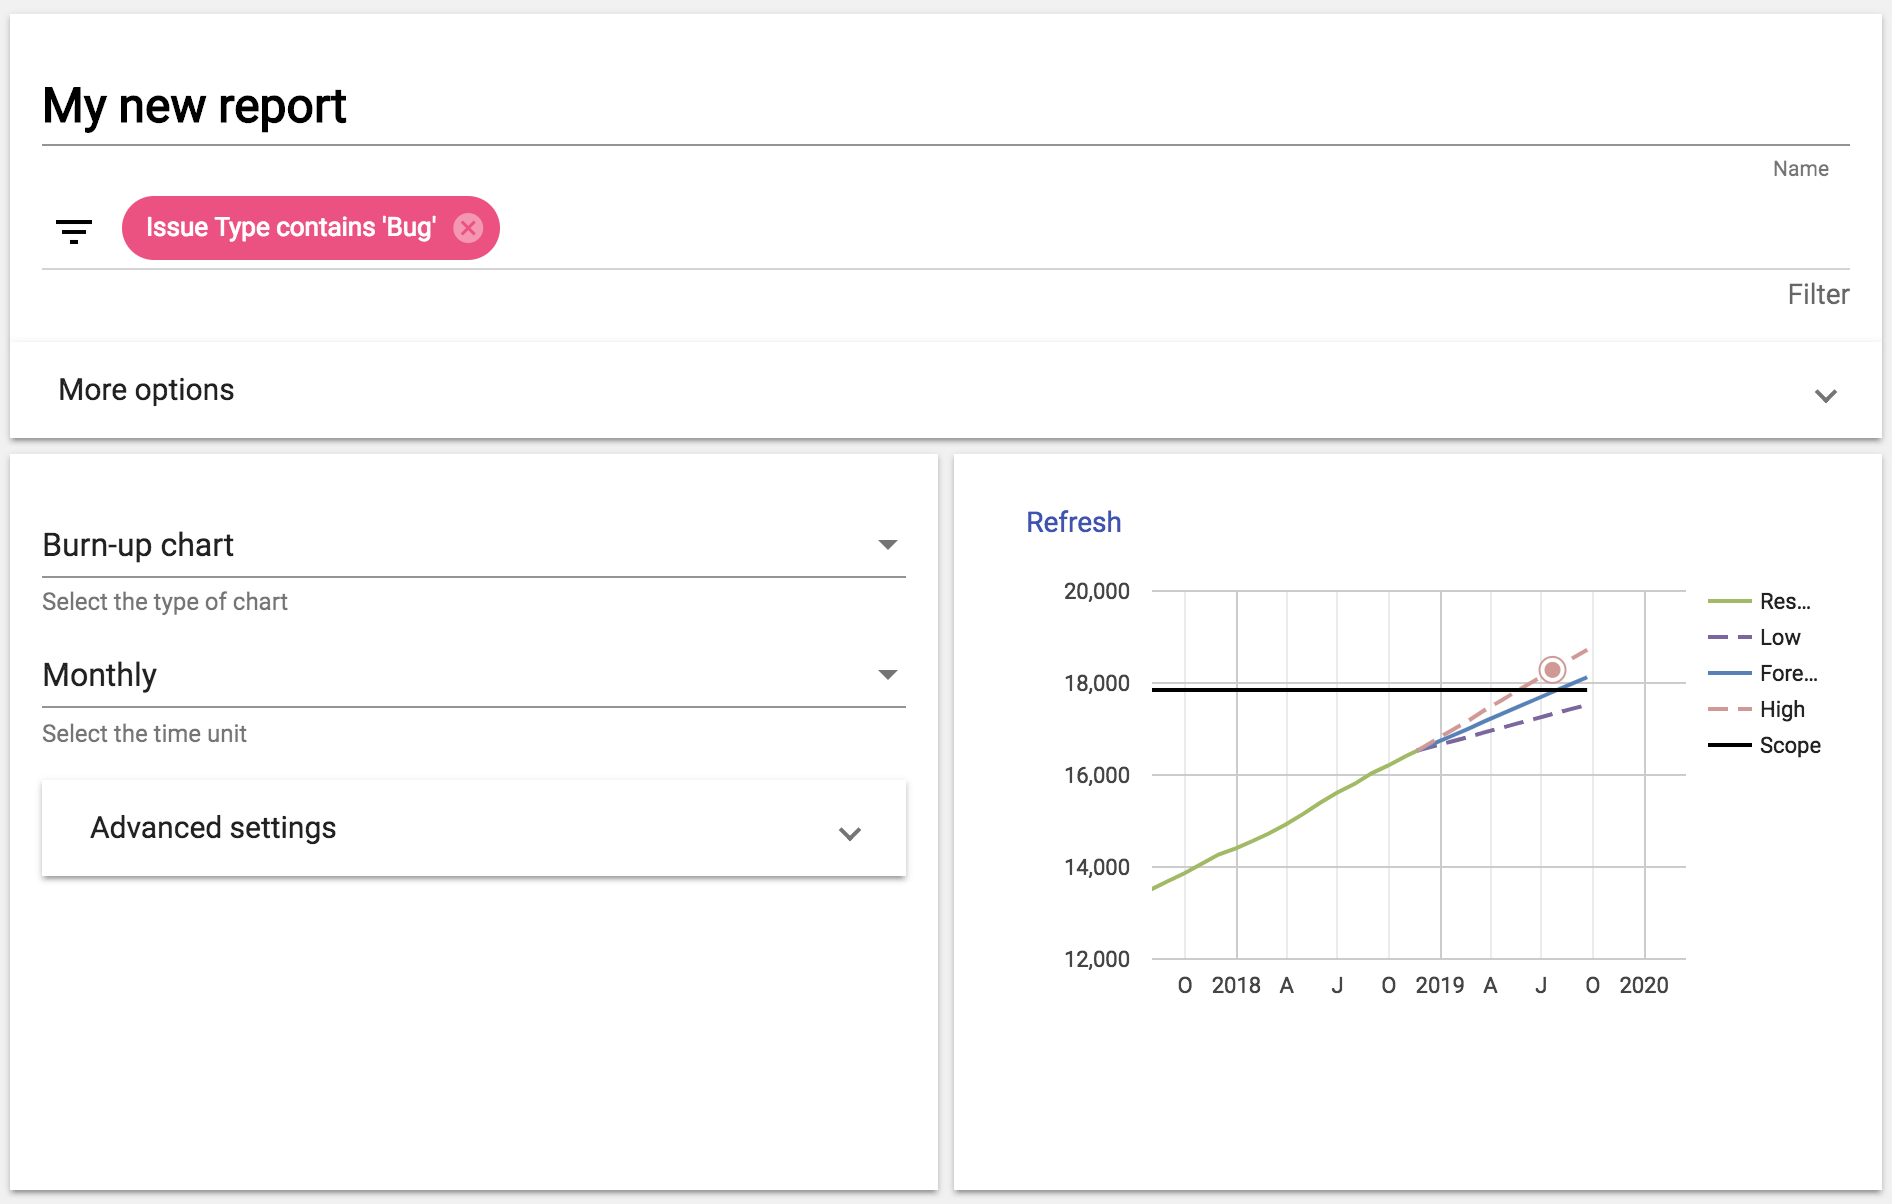
The burn-up chart contains a few lines:
- A scope line (all tickets that match the filter).
- A resolved line (tickets resolved).
- Three forecast lines, one that represents the average velocity and other two for the high and low end of the standard deviation.
Filter
A burn-chart has filtering options
Standard filter
The standard filter is used to select the cases that match the given conditions. It contains the same filter options available to other type of reports and dashboards.
With this option the Scope line is calculated as a constant of the total number of tickets that match the given conditions at the moment of the report execution.
Epic filter
The epic filter let the user to select an epic in the selected agile board.
When this filter is selected the scope is calculated taking into account the history. Thus, the scope will not be a constant, instead it will be calculated for each period in history.
Aggregation level
The resolved line is calculated from the resolution date field. These values can be aggregated on three time units.
- Monthly
- Weekly
- Daily
Forecast
The samples of the forecast are calculated using the specified aggregation level.
There are two main options to select the cases to calculate the standard deviation:
- Burned. This option will use the most recent values of completed periods that are visible in the chart.
- Historical This option will perform a complete separate calculation from the one used in the chart. it will use the same aggregation level but it will ignore all filters and will calculate the samples to create the standard deviation from all the most recent resolved tickets.
Forecast size
This option let users to define how many periods to draw after the current date.
Forecast sample size
This option let users to define how many periods in the past are used to calculate the standard deviation. This option can be used to calculate the velocity based only on recent periods, thus the velocity from old periods is ignored.
Target
Optionally the users can define a target date to highlight the specified axis. The target date can be defined from different sources
- Custom date. With this option the user can set a custom date to highlight an axis.
- Release date. With this option the user can select a release. The target date will be calculated from the release date of the given version.
- Epic date. With this option the user can select an epic. The target date will be calculated from the due date of the given epic ticket.