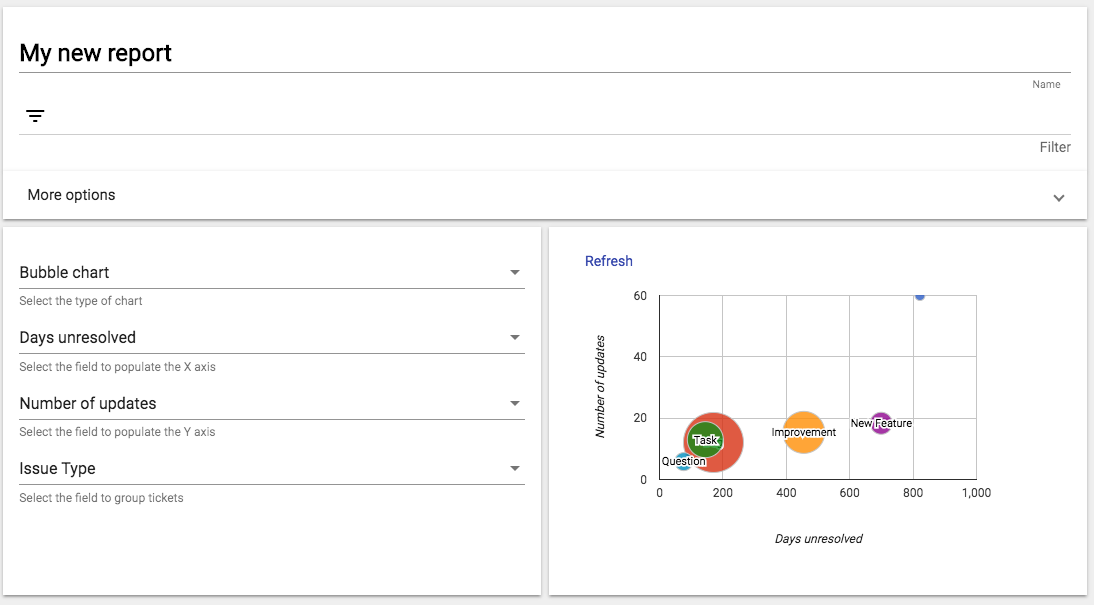
Coordinates
- Numerical field to populate x axis
- Numerical field to populate y axis
Group
The field to group the results. This dimension will be displayed with one color per value of the variable and with sizes according to the number of cases. The size and color of the bubbles allow a visual comparison of the results in a simple view.